Statistical and predictive COVID-19 analysis with powerful visualizations
StopCorona provides global and regional statistical information for the unprecedented coronavirus outbreak. We have collected all the critical information to help the community with the pandemic response.


Created and developed by Diffco
The project was born and fully implemented within our team. We have used the combined experience of our best professionals to make our contribution to the fight against COVID-19.
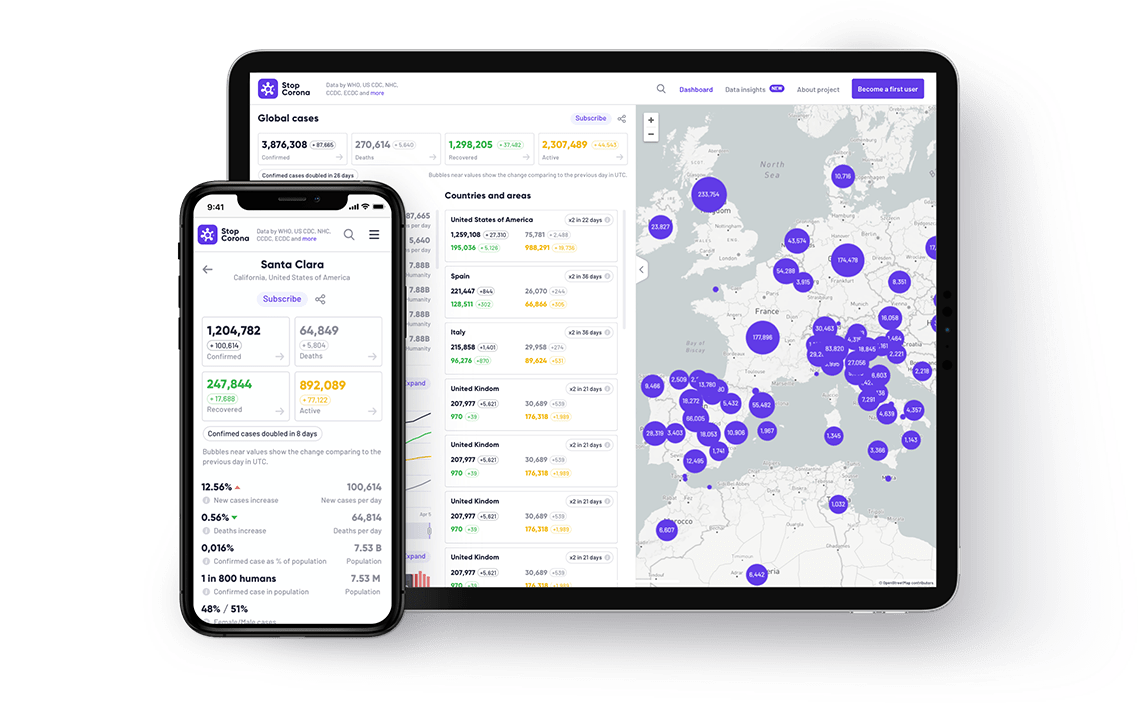
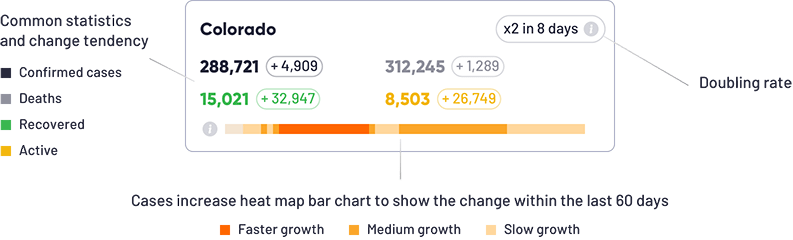
Different levels of tracking by area
See multidimensional information in a structured way. Track insightful statistical data and view charts per single country, city or even district. Switch between the areas simply by searching or navigating the lists.
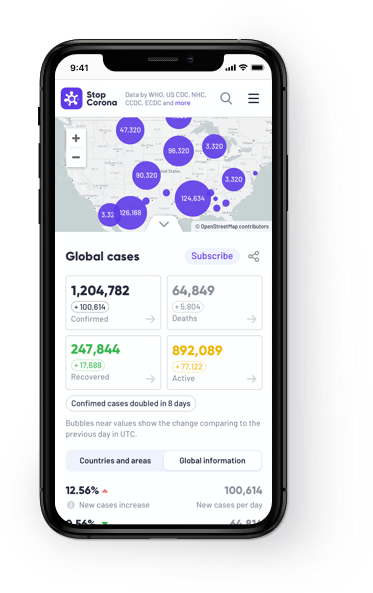
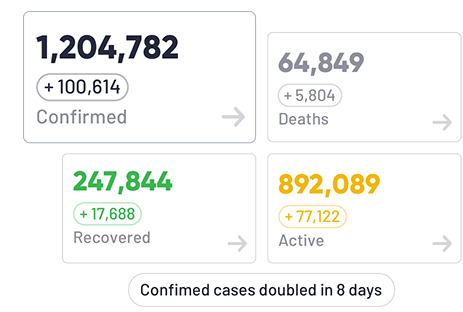
Global statistics
Investigate four core parameters and monitor the change in trends daily.
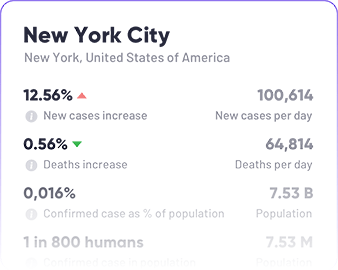
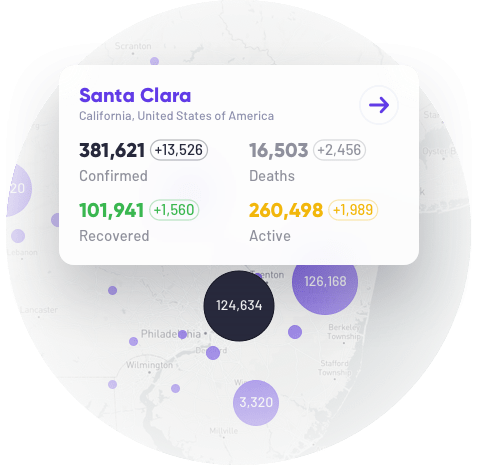
Detailed information for the areas
Learn more about the spread of COVID-19 in any area by comparing the hospital resource use, proportion of the population infected, age groups and more.
Powerful visualizations
When it comes to presenting multidimensional and complex data to users, visualization plays a critical role. To show the information to our users in the most convenient and structured way, we have built a range of interactive charts.
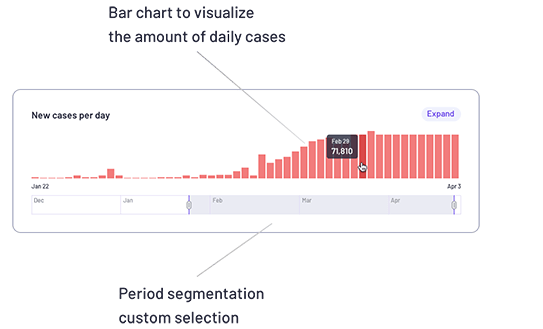
Daily tendency
Bar charts represent the daily statistics, which help to monitor the coronavirus spread trends.
Area preview
Each bigger area has a hierarchy of smaller regions inside, so that users can track their exact location and neighboring cities, states, or countries. Monitor the virus outbreak within the country, state or see the differences between neighboring regions within the country.
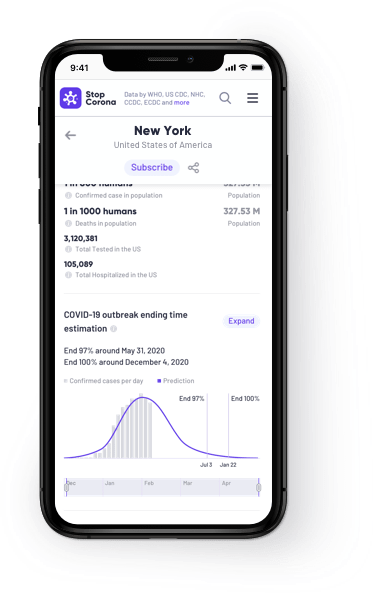
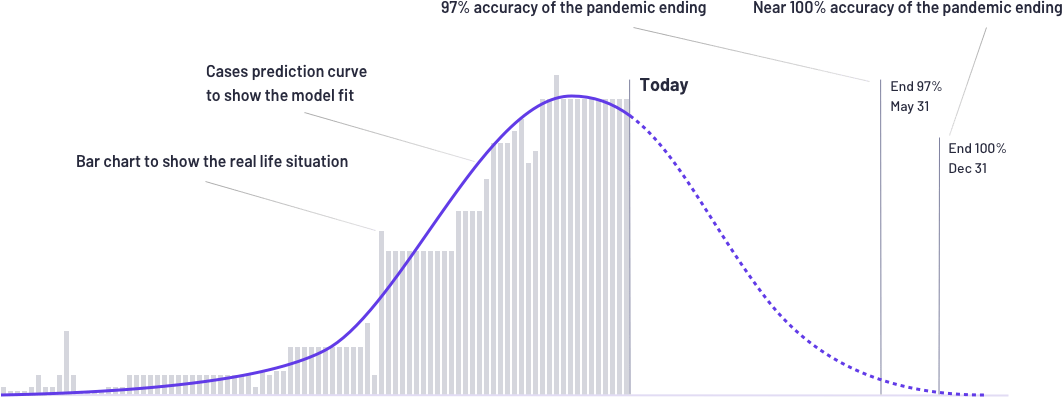
When might the COVID-19 pandemic end?
We have used a common SIR model (Susceptible, Infectious, or Recovered compartmental model in epidemiology) to simulate the coronavirus spread and predict the amount of cases in the future for global, country and state levels. It is used with daily case data from different areas to estimate the pandemic development trends and predict when the pandemic might end. The predictions are updated with the changes in the case data and can be compared with the different responses all over the world.
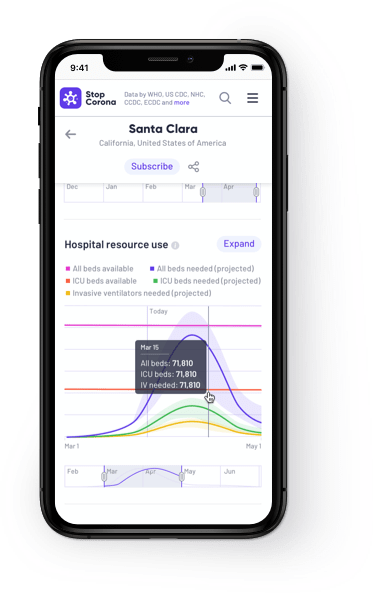
Hospital resource use
Projected resource usage depicts the comparison of healthcare system capacity to the modeled need required by COVID-19 patients in the selected countries, taking into consideration the normal resource usage.


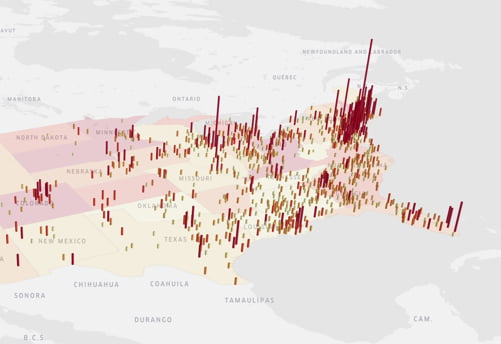
Powerful map
Investigate the global statistics by visualizing an interactive outbreak map. The map was specifically designed and optimized for comfortable work on any device.
3D bar chart for the USA
Using Kepler data analysis functionality, we have implemented a 3D cases visualization for the USA to make the data understanding easier.
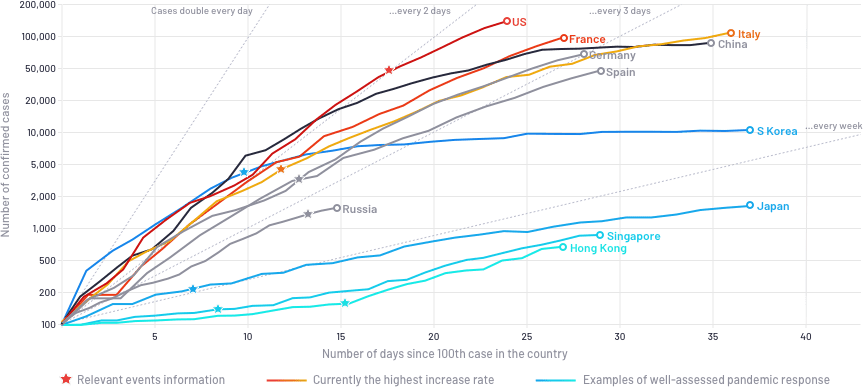
Comparison of rate of increase of confirmed cases by country
Investigate the speed of the infection spread across the countries and compare it to the measures taken. The line angle depicts the rate directly, helping complex data to become readable by everyone.

COVID-19 testing application integration
We have integrated our partner's TestDirectly application to allow users to sign up for the virus tests today and antibody tests in the future.
Our partners


We use only official public data sources
We put together data from multiple medical and governmental organizations and represent it in a user-friendly format.
- World Health Organization (WHO)
- BNO News
- China CDC (CCDC)
- Hong Kong Department of Health
- Macau Government
- Taiwan CDC
- US CDC
- Government of Canada
- Australia Government Department of Health
- European Centre for Disease Prevention and Control (ECDC)
- Ministry of Health Singapore (MOH)
- Italy Ministry of Health
- Financial Times
- The New York Times
- La Repubblica
- Asahi Shimbun
- Le Monde
- Google COVID-19 Community Mobility Reports
- Nextstrain COVID-19 studies
- Yandex Maps COVID-19
- Стопкоронавирус.рф
- Santa Clara County Emergency Operations Center
… and more sources you can find on website.
Let’s build something
great together
We believe in turning ideas into reality and we're ready to join your journey. Reach out to us and let's start discussing your project.